

Do you want to speed up how long it takes you to report on marketing activities? The answer is probably yes.
Marketing has so many different metrics to look at, report on and generally analyse to the nth degree. Going through everything every week (Or even more frequently) can add up to a ton of time.
In this post, we will look at the three areas that categorise the different marketing metrics and focus on which ones actually matter
The Three Types of Marketing Metrics
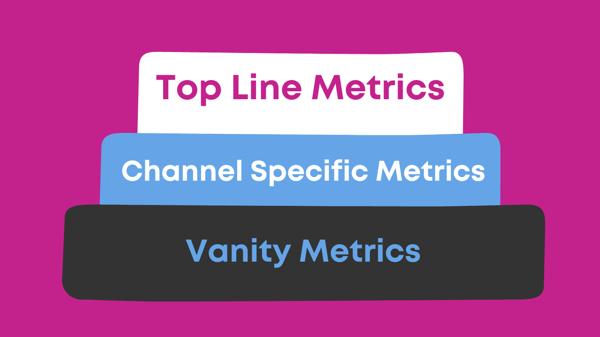
Marketing metrics can be split into roughly three types. The first category is your Top Line Reporting. These are the figures you will need to report on to managers (or the board, or whoever is looking at your reports). They are also the metrics which have the closest direct link to revenue generation.
Next are the success metrics for the different channels that you're using (how many of your marketing emails are seeing click throughs, for example).
Finally, we also have the vanity metrics. You've probably heard marketers talk sneeringly about vanity metrics and there’s a reason why few businesses worth their salt pay them much attention - they're lovely to see but they don't actually tell us what's going on with our marketing. There are a couple of small caveats to this, which we'll explore further when we talk in more detail about vanity metrics.
Top Line Metrics
These are the metrics you have to focus on if you only have a short period of time to do your reporting. When you report back to your boss or the board, you can point to these figures to prove the impact your marketing is having.
The big one is obviously Return on Investment. This is a big topic so let's look at the other measures that you need in order to be able to calculate your ROI and report it.
The first one is the number of leads generated. This is just a bare number of leads - not broken down by channel, not broken down by product - simply the top line of how many leads marketing has generated this month or quarter.
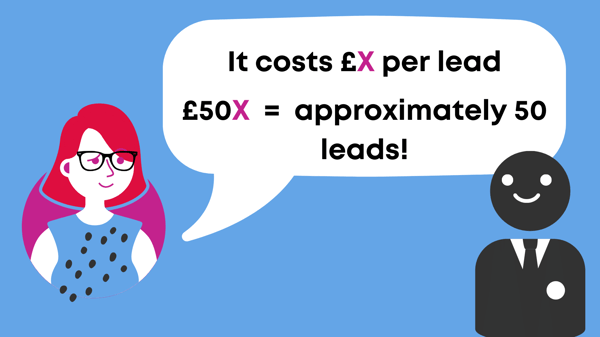
Then, you’ll want to look at how many of those leads turned into customers to discover your lead to sale ratio. This can help you start to predict what’s going to happen in the future. If you know that your lead to sale is one percent, you can estimate how many customers you will get if you manage to achieve 100, 500 or 12,000 leads.
Once you’ve calculated how much you're spending on your marketing, knowing your lead to sale can also allow you to work out your “Cost per Lead”: How much it costs the business to get each lead.
To benefit your marketing strategy, you will want to do this for each channel your company uses to find out which are the most effective but, when it comes to top line reporting, an overview will usually convey the information necessary. Being able to tell your line manager that it costs you - for example - £10 to get a lead is vital if you ever need to ask for a larger budget, as you will be able to predict the amount of leads that can be achieved with different amounts of investment.
Also tied into this is your Customer Acquisition Cost: How much money it takes for you to get a new customer. This will be higher than your Cost per Lead since not every lead turns into a customer.
If you know these figures, you can report back how effective your marketing is.
Channel Specific Metrics
These are the tactic-based metrics that can work to help you to generate more leads in the future, ultimately improving your top line marketing metrics.
The first of these measures is your Traffic per Channel. This means how many people are clicking through to your website or platform from each of your different channels - for instance, organic traffic, direct traffic, paid advertisements and various social media profiles. Knowing this metric can help you to weigh up whether a certain channel is worth continuing with and which ones may need more time invested in them. There may be little point spending precious time creating Instagram content each week if it isn’t generating any traffic, or maybe it’s a sign you need to rethink your strategy on that channel.
Next, there’s your Cost per Click. This measures how much it costs to get a click from any platform you’re using for PPC advertising- such as Google, Facebook or LinkedIn. You will also need to know the optimisation scores for those channels since you don't want to be spending time, money, and effort targeting a channel that doesn't bring you leads.
Another metric to consider is how many people are clicking your call to actions (CTAs) and how many people are completing the action intended. CTAs are usually designed to generate leads and lead generation, as we've seen, is a top line metric.
You may also want to look at how many of your CTAs aimed at prospects at the bottom of your funnel are converting leads into customers. By keeping an eye on your CTA metrics, you can learn what works for your audience, perform A/B tests and, over time, improve your lead and customer generation.
Vanity Metrics
These are metrics that don’t necessarily impact the bottom line – things such as likes, follows, subscribers, shares and so on. Obviously, these things are lovely to see as a marketer but, if you can’t relate the numbers back to a revenue figure or number of leads, it counts as a vanity metric.
The more people that see our content, usually the more chance it has of converting. However, you might make a piece of content that goes viral but does not actually convert anyone into a customer. If you are a newer business that is aiming for greater brand awareness, the virality might still have some value in acquainting people with your brand, but this only really applies when those seeing it are a part of your target market.
This doesn't mean you shouldn't look at and enjoy these metrics but, if you are focused on building likes, you are not going to be focused enough on building revenue.
As we mentioned in the introduction, there is a small caveat: if you can relate something like a number of shares back to a lead or revenue target, then there is value to it and it may be worth checking in on more frequently.
When you look at these kinds of social media or SEO metrics, you need to consider:
- Whether they affect how many prospects become customers
- If the content is appealing to the right audience to generate leads
If what you're reporting on to the top line is leads, then everything you do should be building up to that. If you're reporting on likes, shares, and follows at the top level, you will have a much harder time proving the value of marketing and getting more budget.
Reporting Frequency
In order to speed up your marketing reporting, you should have a frequency cap on how often you look at each type of metric.
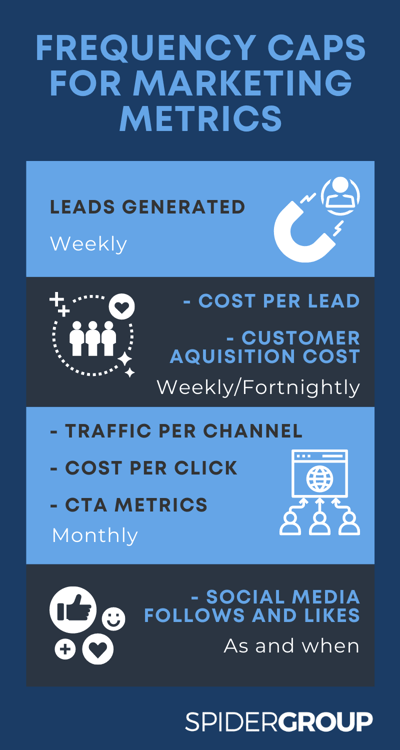
As a general rule, your top line reporting should be weekly, particularly when it comes to leads generated. This allows you to assess where you are in terms of monthly lead goals, even if you are not reporting weekly to a manager.
With the Customer Acquisition Cost and Cost per Lead, it may work better to look at them fortnightly if you’re working with a relatively small budget and a small number of leads, since you may need more time for things to happen.
Channel Specific Metrics should be looked at monthly. Many marketers will check them weekly in order to be on top of the numbers but, with that, the challenge is that you may get lots of fluctuations week by week. This might occur if there’s an event going on in the world that triggers more or fewer searches than normal, or if a piece of topical content spikes traffic for just a small period of time.

If you have a gigantic audience, fluctuations won't look huge but if you have a medium or small audience size, those fluctuations can seem enormous and skew what you decide to do strategically. Checking these figures by month instead doesn’t only save you time but allows you to become more thoughtful about how you use the data.
Vanity metrics do not need to be checked frequently as these do not measure the effectiveness of your marketing strategy. You might check metrics such as likes and follower counts every quarter, every few months, or just when you remember. Give yourself the grace to not feel bound to keep track of them weekly or monthly.
Follower counts on all the social platforms can vary at a moment’s notice, particularly on twitter, so checking the stats on these too frequently can cause you to panic over the little jagged lines rather than the overall upward curves.
Use your reporting sensibly and strategically to help you to focus on the things that matter rather than spending too much time in spreadsheets reading reports and graphs when that won't help you towards your ultimate goal.
Quick Tips for Speeding up Reporting
When it comes to faster reporting, dashboards and templates are your best friend. If you use any kind of marketing platform, spend some time setting up your dashboards so that, at a glance, you can fill in those essential numbers in your records.
Building useful templates also requires a time investment up front. Make sure they are clean and crisp with all of the calculations you need already in them so that, when you type in the number of leads or customers, it automatically spits out your lead to sale ratio. You may also choose to highlight the cells you need to fill in each week or month to make the process as effortless as possible.
The other area worth looking at is systems and processes. As marketers, maybe we see ourselves as creatives more than people who work well with regular processes but they can really help to take the stress out of reporting.
If you know that reporting happens every Monday and it involves looking in these specific places for these specific figures, it not only saves you time but helps you to delegate. If you're away on holiday for a few weeks, you can make sure someone else is able to generate those reports due to the process in place.
Each of these strategies require a little bit of a time investment to start with but, going forward, will save you time every week for the foreseeable future.